Note
Click here to download the full example code
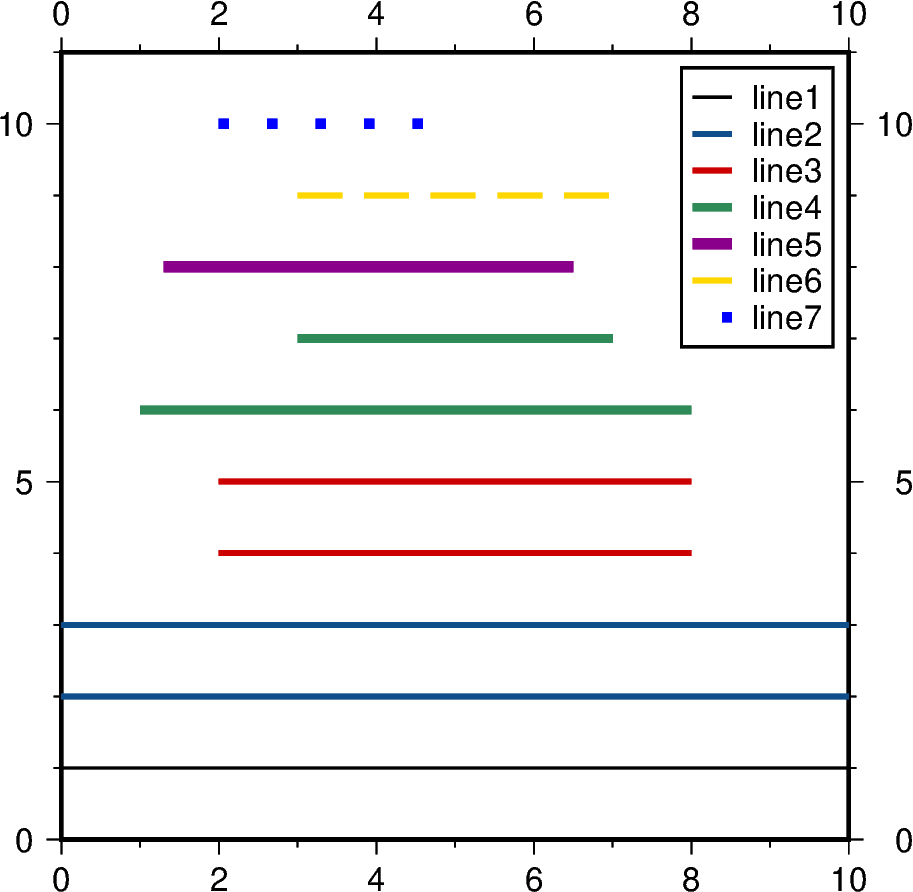
Plot horizontal lines
The pygmt.Figure.hlines method can plot horizontal lines based on
a given y value. Optionally, the lower and upper limits of the lines can be
defined, otherwise the current map boundaries are taken.
Out:
<IPython.core.display.Image object>
import pygmt

fig = pygmt.Figure()
fig.basemap(region=[0, 10, 0, 11], projection="X10c/10c", frame=True)

fig.hlines(1, label="line1")
fig.hlines([2, 3], pen="2p,dodgerblue4", label="line2")
fig.hlines([4, 5], xmin=2, xmax=8, pen="2p,red3", label="line3")
fig.hlines([6, 7], xmin=[1, 3], xmax=[8, 7], pen="3p,seagreen", label="line4")
fig.hlines(
    [8, 9, 10],
    xmin=[1.3, 3, 2],
    xmax=[6.5, 7, 5],
    pen=["4p,darkmagenta", "2p,gold,--", "3.5p,blue,."],
    label=["line5", "line6", "line7"],
)

fig.legend()
fig.show()
Total running time of the script: ( 0 minutes 3.332 seconds)